What Is Data Visualization and Inforgraphic
Data Visualization is the study of visual representation of data, meaning “information that has been abstracted in some schematic form, including attributes or variables for the units of information.” The main goal of data visualization is to communicate information clearly and effectively through graphical means. To convey ideas effectively, both aesthetic form and functionality need to go hand in hand, providing insights into a rather sparse and complex data set by communicating its key-aspects in a more intuitive way.
Data visualization is the presentation of data in a pictorial or graphical format. It is communicated by collecting and analyzing data. Decision makers at all levels welcome data visualization software that enables them to see analytical results presented visually, find relevance among the millions of variables, communicate concepts and hypotheses to others, and even predict the future.
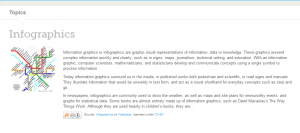
Infographics are graphic visual representations of information, data or knowledge. These graphics present complex information quickly and clearly, such as in signs, maps, journalism, technical writing, and education. Today information graphics surround us in the media, in published works both pedestrian and scientific, in road sign and manuals. In newspapers, infographics are commonly used to show the weather, as well as maps and site plans for newsworthy events, and graphs for statistical data.
Categories: Uncategorized
No Comments »
« My 30 Day Challenge | Home | 30 Day Challenge Update »

